fcc Copper (7 WFs from 12 bands), 8x8x8 k-point mesh.
Wannier90 input
begin unit_cell_cart
bohr
-3.411 0.000 3.411
 0.000 3.411 3.411
-3.411 3.411 0.000
end unit_cell_cart

begin atoms_frac
Cu 0.00   0.00   0.00
end atoms_frac

begin projections
Cu:d
f=0.25,0.25,0.25:s
f=-0.25,-0.25,-0.25:s
end projections
Output from Wannier90
  WF centre and spread    1  (  0.000000,  0.000000,  0.000000 )     0.42047677
  WF centre and spread    2  (  0.000000,  0.000000,  0.000000 )     0.32847090
  WF centre and spread    3  (  0.000000,  0.000000,  0.000000 )     0.32847090
  WF centre and spread    4  (  0.000000,  0.000000,  0.000000 )     0.42047655
  WF centre and spread    5  (  0.000000,  0.000000,  0.000000 )     0.32847036
  WF centre and spread    6  ( -0.902512,  0.902512,  0.902512 )     1.39628779
  WF centre and spread    7  (  0.902512, -0.902512, -0.902512 )     1.39612106
  Sum of centres and spreads (  0.000000,  0.000000,  0.000000 )     4.61877432
Wannier Functions
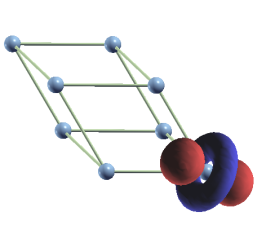
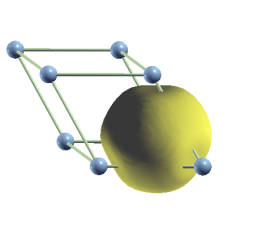
The more localised WFs (1-5) all look like the image on the
left, whereas the other two are similar to the image on the
right. All WF are real.


The band-structure from Wannier Interpolation.
The lower horizontal line is the
Fermi level, the next line is the inner window and the upper line is the outer
window.
Blue lines are Wannier Interpolation, red lines are from a
non-self consistant pwscf calculation.

The band-structure from Wannier Interpolation.
The colour field is a projection of the two interstitial WF (6 and 7) onto the Bloch states (of the optimal subspace).

Input files copper.tgz